Scientists release a ‘colossal’ map of the universe featuring over one billion galaxies
>
The largest two-dimensional map of the universe ever created just got even bigger.
Thanks to a ‘colossal’ update, the ambitious project to chart the vast night sky above our heads now features more than one billion galaxies.
Its aim is to help astronomers better understand the make-up of the universe, which in turn could help them unravel the mysterious properties of dark matter and dark energy.
Creating comprehensive maps of even the dimmest and most-distant galaxies boosts this endeavour, which is why the tenth data release from the Dark Energy Spectroscopic Instrument (DESI) Legacy Imaging Survey is so important.
Ultimately, astronomers want to precisely map the expansion history of the universe over the last 12 billion years.
Vast: The largest two-dimensional map of the universe ever created has just got even bigger

Mesmerising: Thanks to the tenth data release from the Dark Energy Spectroscopic Instrument (DESI) Legacy Imaging Survey (pictured), the ambitious project to chart the vast night sky above our heads now features more than one billion galaxies
The DESI survey is one of three that together have imaged 14,000 square degrees of the sky from the northern hemisphere using telescopes at the Kitt Peak National Observatory in Arizona and Cerro Tololo Inter-American Observatory in Chile.
One of the key aims for the map is to identify roughly 40 million target galaxies for the five-year DESI Spectroscopic Survey, to help better understand mysterious dark energy.
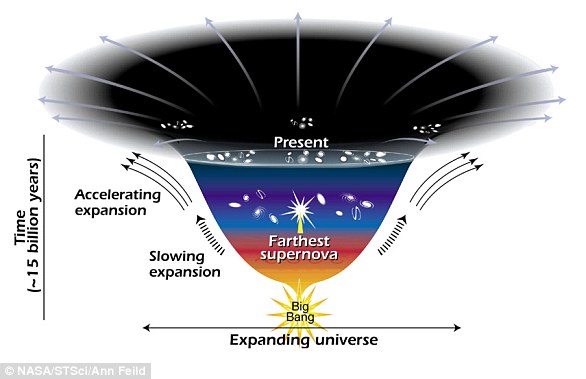
This unusual ‘something’ – one of the great mysteries of cosmology – is believed to be an unknown force that is pushing things apart more strongly than gravity and causing the universe’s expansion to accelerate.
Dark energy makes up almost 70 per cent of the universe but hardly anything is known about it.
Just last week, however, scientists from Imperial College London suggested that they may finally have an explanation for its source — black holes.
They observed ancient and dormant galaxies and found that black holes gain mass in a way that is consistent with them containing vacuum energy, or dark energy.
In fact, the size of the universe at different points in time fitted closely with the mass of supermassive black holes at the heart of galaxies.
In other words, the amount of dark energy in the universe can be accounted for by black hole vacuum energy — meaning black holes are the source of dark energy.
Separately, researchers behind the DESI project have selected its targets and a spectroscopic survey is currently under way, which experts hope could offer more insight into this unseen part of the universe.
The latest data release added to the 2D map incorporates images of the southern extragalactic sky, especially in areas away from the Milky Way’s disk, which are ideal for looking far into the cosmos.
With the addition of this view of the southern sky, it brings the total area mapped to over 20,000 square degrees — nearly half the sky.
Not only that, but the images have been taken in a new infrared colour filter which allows scientists to identify even more of the distant galaxies in different sections of the night sky because it captures a redder spectrum than the human eye can see.
The more redshifted a galaxy’s spectrum is, in general, the farther away it is.
‘The addition of near-infrared wavelength data to the Legacy Survey will allow us to better calculate the redshifts of distant galaxies, or the amount of time it took light from those galaxies to reach Earth,’ said Alfredo Zenteno, an astronomer with NSF’s NOIRLab.

Mapping the sky: The DESI survey is one of three that together have imaged 14,000 square degrees of the sky from the northern hemisphere using telescopes at the Kitt Peak National Observatory (pictured) in Arizona and Cerro Tololo Inter-American Observatory in Chile
Mara Salvato, a researcher at the Max Planck Institute for Extraterrestrial Physics, added: ‘This is essential for surveys at radio and X-ray wavelengths that need the complete “optical” view to identify the origin of the emission, like clusters of galaxies and active supermassive black holes.’
The other great thing about this new data is that it has been made publicly available.
This means that astronomy enthusiasts or those curious enough to want a glimpse of the massive universe around us can also take a peak.
‘Anyone can use the survey data to explore the sky and make discoveries,’ said Arjun Dey, an astronomer with NSF’s NOIRLab.
‘In my opinion it is this ease of access which has made this survey so impactful.
‘We hope that in a few years the Legacy Surveys will have the most complete map of the entire sky, and provide a treasure trove for scientists well into the future.’

